At Beyond Plans, we explore every new Anaplan innovation to turn it into a real business performance driver for our clients.
Anaplan XL Reporting, the result of Anaplan’s acquisition of Fluence Technologies in 2021, is now fully integrated into the platform. While it was originally designed with finance teams in mind, its relevance extends far beyond. Here’s our expert take on this high-value solution, built to deliver power, flexibility, and ease of use.
Far from echoing the usual narratives about the end of Excel, Anaplan takes a bold stance: enhancing rather than replacing it.
Anaplan XL Reporting (formerly FluenceXL) is based on a simple, widely observed fact: business teams still rely heavily on Excel especially for reporting, analysis, and financial communication.
With this advanced connector, Anaplan offers a 100% Excel add-in that is fully integrated with centralized, consolidated, and governed data in Anaplan. Users can keep their familiar Excel environment while leveraging the full power of a collaborative, real-time cloud platform.
Powerful Business Capabilities, Instantly Accessible
More than just a bridge between Excel and Anaplan, this solution brings robust, business-ready features that go well beyond simple data integration. Here are the key functionalities we consider particularly impactful for operational teams:
Real-Time, Multi-Source Connectivity
Compatible with over 30 systems (including Anaplan, SQL, SAP, Power BI, etc.), either natively or via middleware, Anaplan XL ensures seamless integration. Data in Excel is refreshed dynamically no manual re-entry or information gaps. The direct connection to Anaplan leverages its export API and optimized modules or views for fast, accurate queries.
Automated Reporting
Report distribution can be fully automated, ensuring the right metrics reach the right stakeholders at the right time without manual effort. This significantly enhances both reliability and auditability.
Note: Advanced automation (report bursting) is enabled via an additional component called XL Publisher, inherited from Fluence. This feature is not included in the base Excel add-in.
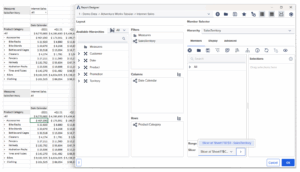
Interactive and Customized Reporting

Example formula:
=XL3Lookup(“Chart of Accounts”, “Total Expenses”, “2024”, “France”)This enables real-time
queries from an Anaplan module directly within Excel.
User-Friendly for Business Teams
No new tools to learn everything is built on native Excel standards (formulas, slicers, defined names, cell references), ensuring fast and frictionless adoption by business users.
Data Governance
Data never resides permanently in the Excel file. Instead, it is pulled in real-time from Anaplan (or other sources) based on user access rights defined within Anaplan (including SSO, roles, and permissions). Once retrieved, data can be manipulated, saved, or exported but this flexibility requires clear usage governance. This model ensures security, consistency, and auditability.
Balancing User Agility with Centralized Governance
What stands out most in Anaplan XL Reporting is its ability to bridge two often conflicting needs: business users’ autonomy in building reports and analyses, and the control required by finance, IT, or performance teams.
With advanced functions, users can query highly specific datasets from Anaplan or other platforms achieving a level of granularity rarely available in Excel alone. Even complex regulatory reports can be replicated and refreshed in just one click.
Whether creating lightweight dashboards or deeply structured reports, the grid- or formula-based approach enables tailored levels of interactivity for every use case.
Extending Beyond Finance
While originally designed for finance teams (regulatory reporting, closing, budgeting, etc.), Anaplan XL Reporting is quickly gaining traction across other business functions:
-
Sales: performance dashboards, margin analysis, personalized activity reports
-
Supply Chain: service level monitoring, inventory tracking, real-time demand coverage
-
Human Resources: headcount tracking, payroll forecasting, FTE vs. budget analysis, absenteeism and turnover by site
Each department can work with its own metrics, filters, and hierarchies within a unified, governed reporting framework.


